Standards + Practices
Science
DCI: ESS2.C The Roles of Water in Earth’s Surface Processes
ESS2.D Weather and Climate
CCC: Cause and Effect
SP4: Analyzing and interpreting data
Students will be analyzing and interpreting data from stations around the US. See Narrative and Science Content Supports.
SP5: Using Mathematics and Computational Thinking
Students will be using mathematics and computational thinking as they analyze and interpret the data from the Water Year Summary Reports for paired stations near mountain ranges. See Narrative and Math/Science Content Supports.
Mathematics
MP2: Reason abstractly and quantitatively
MP4: Model with mathematics
MP5: Use appropriate tools strategically
MP6: Attend to Precision
Resources + Supports

Rain Shadow Effect
The rain shadow effect refers to a phenomenon where one side of a mountain has much more rainfall than the other side because the mountain casts a “shadow” on one side sheltering it from prevailing rain-bearing winds and keeping it much drier than the other side. In addition, consider that the altitude of the mountain range has an impact on the intensity of the rain shadow effect. Mountain ranges that are higher in altitude can cast a greater “shadow” on the leeward side of a mountain. Remind students that geographic features such as distance to large bodies of water also relate to the amount of precipitation that stations receive relative to other stations. For more support on this concept, consider the following resources:
- Wikipedia Definition
- Rain Shadow videos:
Extending thinking–have students consider exceptions to the rain shadow effect by looking at how large and powerful storms move across a mountain range impacting both the windward and leeward sides. (Students will look at weather events in April, which may provide an opportunity to revisit this idea.) In some cases, the rain shadow effect exists but is minimized in comparison to typical data reported for the water year.

Water Year
You may be surprised when investigating the Water Year Summary Reports that the water year actually runs over two calendar years. The water year for an area begins on October 1st and runs through September 30th of the following year. Water year reports track the surface water supply and help local areas plan for their management of water resources.
More information about the Water Year can be found here on the CoCoRaHS website.

Ms. Clark Explores the Rain Shadow Effect in Oregon
Ms. Clark knows that the Water Year Summary Reports offer a lot of information and wants to help students focus on data that will build their understanding of the rain shadow effect. In addition, she wants to model the process of asking questions to further investigate wonderings that emerge when looking at data. Before her lesson, she selected two stations near Portland, Oregon, one each on either side of the Cascades Range. She also used Google Maps to calculate the distance between these two locations and found that they were about 87 miles apart.
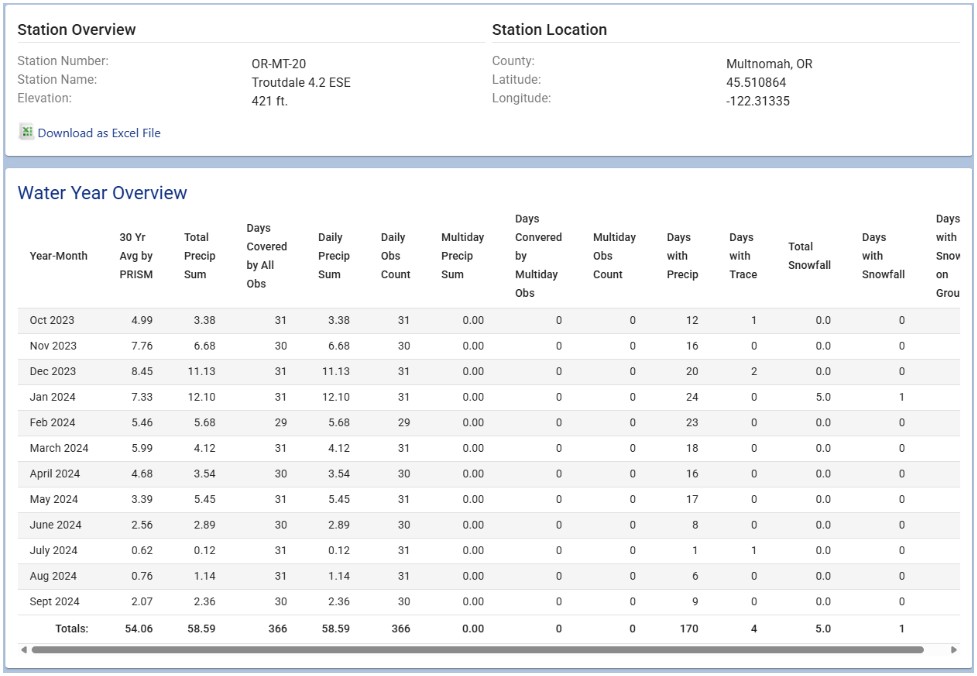
Modeling how to access the Water Year Summary Reports, Ms. Clark locates the Water Year Summary Report for stations OR-MT-20 (windward side) and OR-JF-13 (leeward side).
Station OR-MT-20:
Station OR-JF-13:
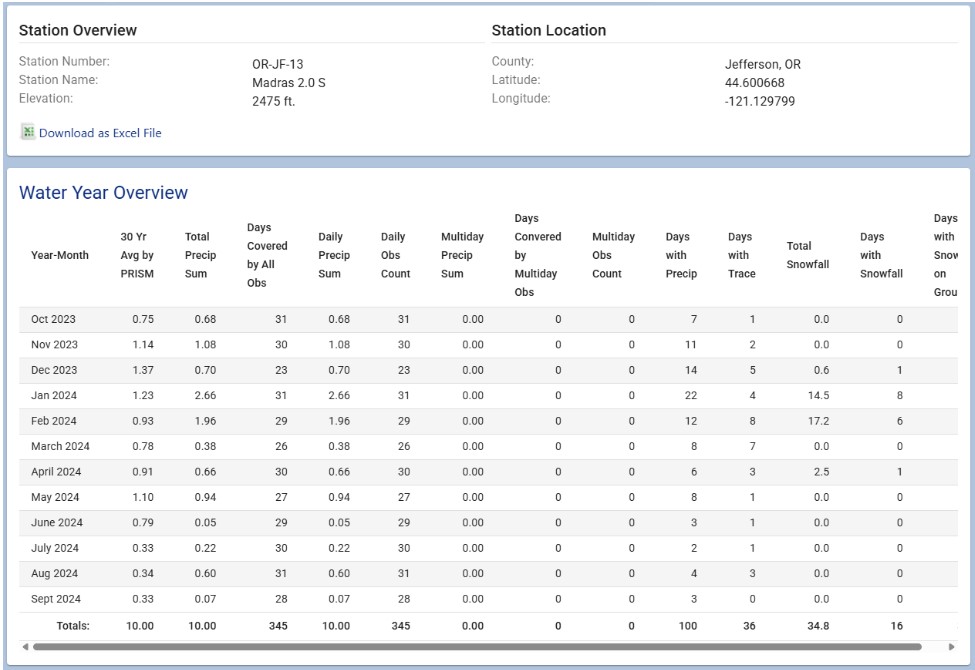
To simplify, Ms. Clark labels these as Stations A (OR-MT-20) and B (OR-JF-13). Ms. Clark draws students’ attention to the “Total Precip Sum” for each station and asks students what they notice about the annual totals. Students notice that station A received a lot more precipitation than station B. Ms. Clark asks students if this is what they would expect and why based on what they know about the rain shadow effect. After a few students share that it aligns with what they would expect, Ms. Clark suggests that it’s still important to look for additional data to support their claim. Ms. Clark notes that stations A and B have similar latitudes and longitudes but vary in their elevation, with A at 421ft. above sea level and B at 2475 ft. above sea level. Ms. Clark shares this noticing with students and uses it to drive an investigatable question, “I see that the station on the windward side is much lower in elevation than the station on the leeward side. So far, it appears being on the windward side of the mountain means that a station will have a lot more precipitation, but I am wondering if my claim would still be true if we compare the windward side (Station A) to a station on the leeward side with a lower elevation? I am going to find a station on the leeward side with a lower elevation and compare its Water Year Summary to my windward station and see what I find out.” Ms. Clark goes through the process of finding a station on the leeward side with an elevation comparable to Station A that also includes a complete data set for the year and identifies station OR-UM-14, referred to as Station C, at an elevation of 393 ft. above sea level, just slightly less than the windward station.
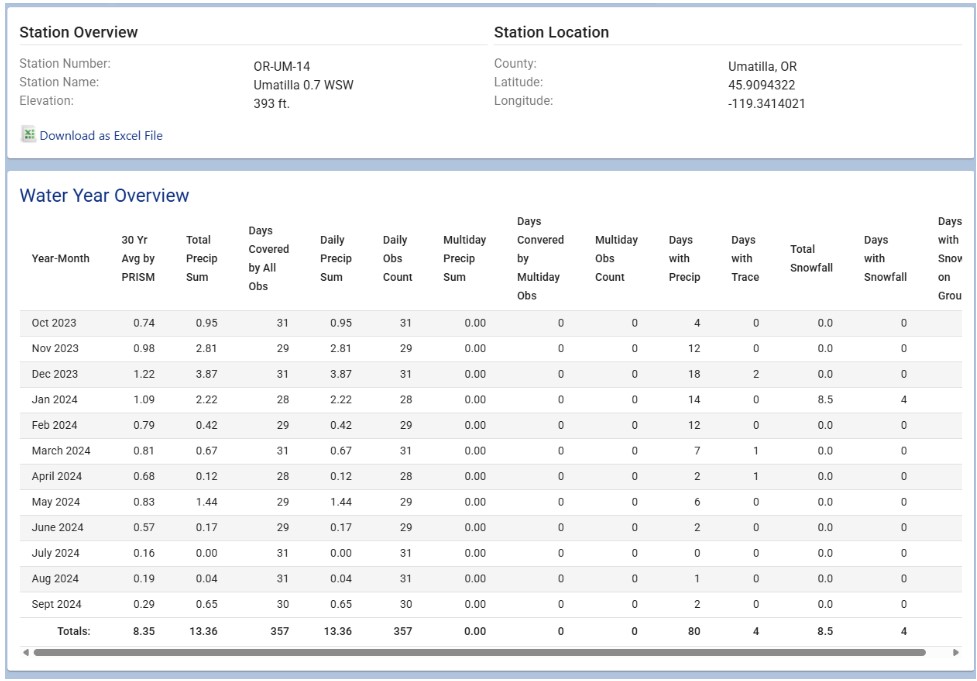
Looking at the data, Ms. Clark asks students what they notice about the total precipitation of Station C compared to Stations A and B. One student notes that Station C received more precipitation than Station B. Ms. Clark asks students to compare Station C to the windward station (Station A), and it is clear that station A has still received much more precipitation than Station C. The two leeward stations have total amounts that are more similar than the windward station. Ms. Clark wonders aloud, “You noticed that Station C had more precipitation than Station B, and now I am wondering if precipitation will increase as the elevation decreases. We could investigate this by looking at other stations of varying elevations on each side of the mountain and seeing if we find this pattern each time. However, I know that many factors influence precipitation, and I notice that Station C, is also really close to a large river, and now I’m wondering if this station had more precipitation than Station B because of its proximity to a water source. I could investigate this by looking at other leeward stations that are near the river and farther away from the river. That’s why I like these types of investigations. As we find something out, we have new questions, and CoCoRaHS has many observers like us that provide data which could end up being evidence for questions we have. As you work in your groups today comparing data from your two stations, think about what additional questions come up and how you might investigate those questions.”

Water Year Summary Report
Selecting Stations
When preparing for this activity, consider whether you will have paired stations selected ahead of time, will encourage students to select their own paired stations, or a combination of both. Regardless, with an abundance of data and stations to choose from, what are some considerations when selecting stations to investigate the rain shadow effect?
1. Geography–look for stations on the windward side of a mountain and the leeward side of a mountain.
-
- Potential areas to consider:
- Pacific Coast Ranges: Olympic Mountains, Sierra Nevada, Cascade Mountains
- Rocky Mountains: Northern Rockies, Middle Rockies, Southern Rockies
- Black Hills of South Dakota
- Appalachian Mountains: Blue Ridge Mountains, Great Smoky Mountains, Allegheny Mountains, Catskill Mountains, White Mountains, Green Mountains
- Potential areas to consider:
2. Available data–after selecting a water year and state, all potential stations in a state appear. You can use the third column “Days Covered by all Observations” to sort data in ascending or descending order to find stations that have covered more days of the water year. Have students consider why they would want to select stations that have more days covered in their analysis.
These two considerations (geography and availability of data) should be used together to select paired stations to illustrate the rain shadow effect. Selecting a station on both the windward and leeward side of the same mountain where each station has more complete data will help provide a more accurate illustration of the rain shadow effect of that mountain range. If students select a pair of stations but are not using the same mountain, help guide students to understand why the data may not illustrate the rain shadow effect in a way that would be expected. Not using the same mountain range for a pair of stations introduces a new set of variables that can impact the illustration of the rain shadow effect.
Accessing Data
To access the Water Year Summary Report for a specific station:
- Go to https://wys.cocorahs.org/
- Select the Water Year and state of focus

3. Sort by station number in the far left hand column to find the station you are looking for.
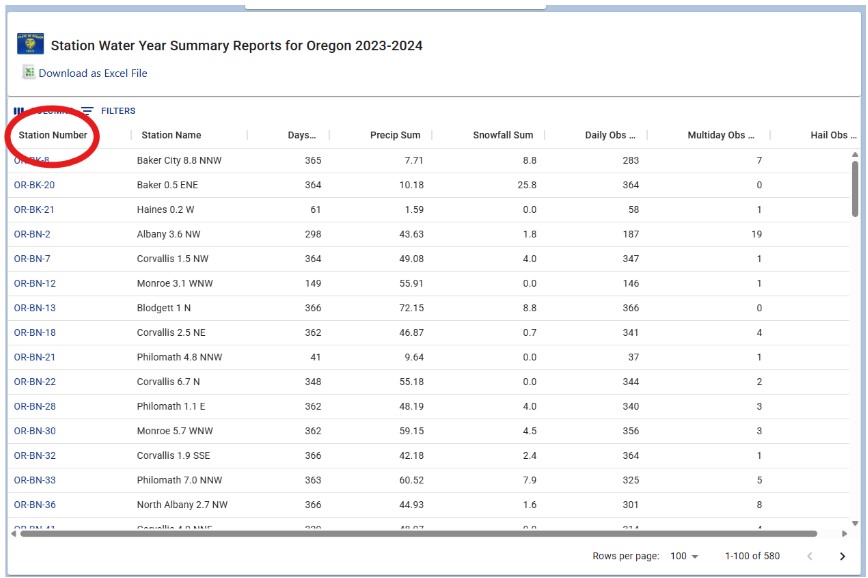
4. If you are not sure what stations you want to use and are trying to decide, spend time looking at a map of the state and identify cities/towns/counties on either side of the mountain to narrow your search. For example, looking for a station in Portland, OR, you would consider station numbers starting with OR-MT because Portland is in Multnomah County. You would filter station names by typing in MT in the filter for Station Number.
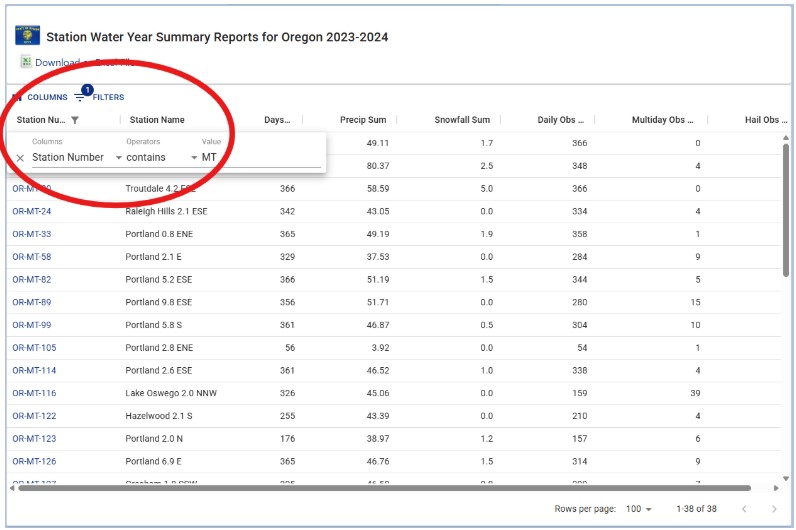
5. Next, sort the stations in the area you are considering by the third column, or “Days Covered by all Obs” by clicking the column title.
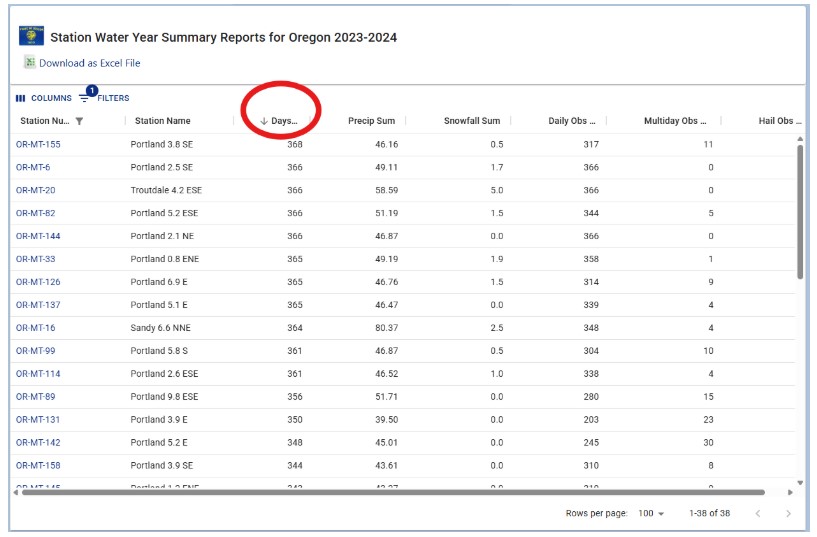
6. Now you can select a station to use in the designated area that has data for all or most days of the water year.
7. Repeat this process for any areas you are trying to find station data to use and/or model this process for students if you would like them to select their own stations for their assigned mountain range.
Side note: Students may be confused about the “Total Snowfall” column and think it can be added to the Total Precipitation. Total Snowfall represents snowfall measured before being melted and measured in the rain gauge so this amount is actually included in the Total Precipitation calculation. For additional clarification, you can use the Station Snow Summary Report and see how the “24-hour Snowfall in.” lines up with the “Total Snowfall” column in the Water Year Summary, which is different from the “Precip in.” column in the Station Snow Summary Report showing the snowfall amount as precipitation reported to CoCoRaHS.

Analyzing and Interpreting Data
As students compare data from multiple stations, it is important to help them focus on data that will contribute to their understanding of the rain shadow effect. With many types of data available on the Water Year Summary report, guide students in identifying the most relevant pieces and making sense of the data using specific questions.
Provide time for the students to review the tables and graphs for each station and use the guiding questions below to help make sense of the data in each station and compare data between the two stations.
Questions for students to consider when interpreting data between two stations:
- What is the latitude and longitude of each station?
- What is the elevation of each station?
- What was the total precipitation for the water year for each station?
- What three months did each station have the most precipitation? Were they the same three months or any differences?
- What three months did each station have the least precipitation? Were they the same three months or any differences?
- When comparing the precipitation for each month, does the same station receive more precipitation than another station or does it switch?
- Was there any snowfall for either station?
- How does the precipitation throughout the year compare to the 30-year average for each station?
- Looking at both stations, what do you notice about precipitation trends during each season?
- Are there any daily reports where you can find a storm that resulted in both stations receiving more than 1.00” of precipitation from the same event (likely the same day or within two days of each other)? If so, how similar or different were the amounts of precipitation that each station received?
- Look at the elevation for each station. Which one is higher?
- If the station on the windward side is higher than the station on the leeward side does it make a difference if you find a different station on the windward side that is a lower elevation than the leeward station, or are the precipitation comparisons similar?
- If the station on the windward side is lower than the station on the leeward side does it make a difference if you find a different station on the windward side that is a higher elevation than the leeward station, or are the precipitation comparisons similar?
Extension questions:
Questions for students to consider when interpreting data between multiple pairs of stations:
- Do stations on the windward side of the mountain consistently receive more precipitation than stations on the leeward side of the mountain?
- Are the differences between the windward and leeward sides greater, smaller, or similar between mountain ranges or different areas of the same mountain range (depending on sets being compared)?
- Are there any surprises or exceptions to the rain shadow effect?
- Look at the elevation of each station. Do you notice any similarities or differences between stations that are at higher or lower elevations?

Connecting With a Class Graph of Data
The Water Year Summary Report offers a 30-year average trend line alongside the bar graph of monthly precipitation data. Recall that students spent some time back in November learning what the average represented in the context of daily and monthly precipitation for their county. Consider bringing out your class graph from your work in October and helping students calculate the average rainfall amount for the data collected on the class graph. Plot the average on the graph as a horizontal line (see example graph below) to help students make sense of what a precipitation average would mean in the context of monthly data. Averages provide a general idea of the amount of precipitation over a set time period, but it is likely that no one day in the month will have recorded the exact average precipitation amount. This may challenge student concepts that an average is “what most are.”
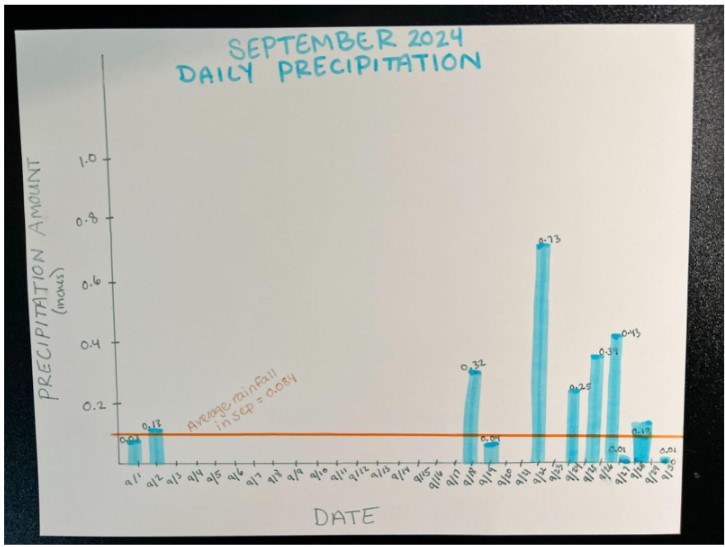
Connecting back the Water Year Summary, guide students in understanding that the 30-year average has been calculated using the previous 30 years of data for each particular month similar to calculating the average for their September class graph (one particular month). For the Water Year Summary, have students notice if months for the particular water year are falling above or below the 30-year average line and notice how similar it may be to the class graph. There is likely not a month identical to the 30-year average just as a single day in a given month is likely not identical to the monthly average line.
Another fun fact to highlight for students is that these 30-year average calculations have recently started using CoCoRaHS data, a great example of the importance of contributing to participatory science projects and how those contributions are used to support scientists in their work. In fact, CoCoRaHS is the largest network of stations that provides precipitation data for the most recent 30-year average.

Rain Shadow
Possible prompts for discussion or written response to help students reflect on their understanding of the rain shadow effect:
- How does the rain shadow effect impact the climate of windward and leeward sides of a mountain range?
- How does the rain shadow effect impact the landscape of windward and leeward sides of a mountain range?
- What circumstances may lead to a reduced rain shadow effect?
 Now that students have looked at data patterns of stations near mountain ranges, next month students will continue making sense of geographic features by looking at data patterns in stations located nearby and further away from large bodies of water. Students will continue to use the Water Year Summary Reports so consider any additional support that would be helpful for your students as they work with these reports. In addition, think about stations that may be of particular interest to your students depending on your proximity to large bodies of water and any connections students have to areas near and far from large bodies of water.

