Standards + Practices

DCI: LS2.AInterdependent relationships in ecosystems
SP4: Analyzing & Interpreting data
Students will analyze and interpret data from their Data Recording Sheets to discuss weather conditions when ladybugs have or have not been found on school grounds to determine what features of these conditions increase the likelihood of finding ladybugs.
SP6: Constructing Explanations
As students consider ladybug searches from different seasons and in different weather conditions, they construct explanations that are supported with evidence using data they have collected throughout the year.
Resources + Supports

The Importance of Consistency
Remember, participatory science relies on the data collected by everyday people, and regular participation is key! The season is changing and more vegetation will be emerging. It will be a great time to get outside with students to continue to collect, photograph, and upload ladybug data as often as possible with your class.
As you’re examining the impacts weather, vegetation, and geographic features have on which ladybugs you find at your school, remember the overarching questions:
1. How does the presence of ladybugs change across the school year? What might explain those changes?
a. Which species of ladybugs do we find at our school? Are they native, non-native, or both?
b. What features of our school grounds make the space habitable/uninhabitable for native ladybugs?
2. How can we improve the habitat for ladybugs in our schoolyard?
The factors you look at this month can help students better understand patterns in the ladybug data they have recorded.

Ms. Jones’ Class Notices Patterns
As students look at data from earlier in the year, Ms. Jones notices that students are mainly focused on what season sightings occurred in, perhaps due to their recent study of seasonal variation as part of their weather unit. For example, one student shares that their class seemed most likely to find ladybugs during their search efforts in the fall, highlighting particularly fruitful efforts in late September. This attention to seasons helps Ms. Jones’s students identify patterns in temperature and length of daylight that align with seasonal patterns. Ms. Jones uses her document camera to project the observation recording sheets from those three searches, asking students what they notice. One student points out that they recorded temperatures between 71°F and 80°F on each of the days. Another notices that all of the sightings on those days occurred in a raised garden bed where another class was growing spinach. Ms. Jones then shared a recording sheet from early October, in which the class searched but found no ladybugs, asking students what they notice. One recalls that particular search effort, remembering that it had started raining when they were outside and it felt much colder. Another notes that the temperature they recorded was between 51°F and 60°F. Ms. Jones reminds students that as they review data, it is important to consider temperature or other conditions observed in addition to the date or season. One student jokes, “It’s not like the ladybugs have a calendar!” Another adds, “But I bet today feels like spring to them! It’s very warm today. Maybe we should go out to look!”

Using Graphs to Compare Data
Analyzing and interpreting data involves organizing and graphing collected data and making sense of it (e.g., finding relationships, patterns, outliers). Various tools can be used in data analysis, including spreadsheets and graphing tools. Observation and reasoning help scientists make predictions and form explanations based on the data.
Have students use Google Sheets or graph by hand to generate graphs using data that have been collected throughout the year of the following:
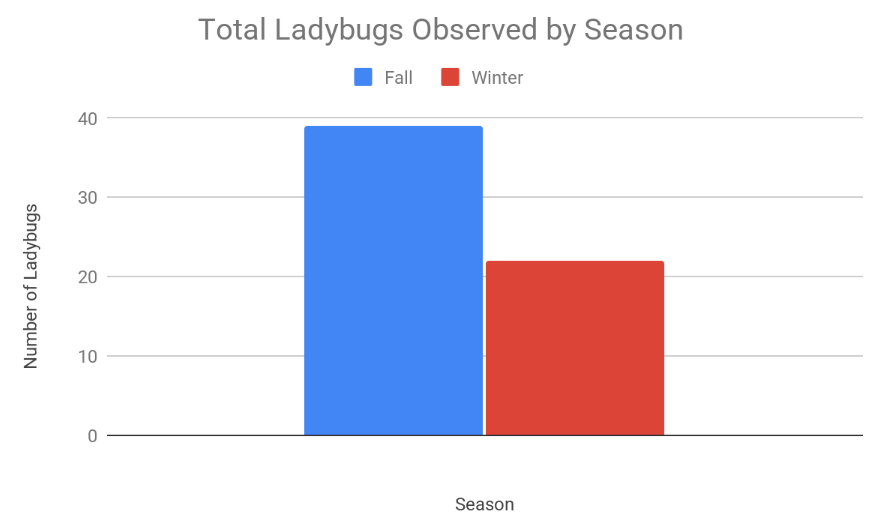
– Total number of ladybugs observed in each season
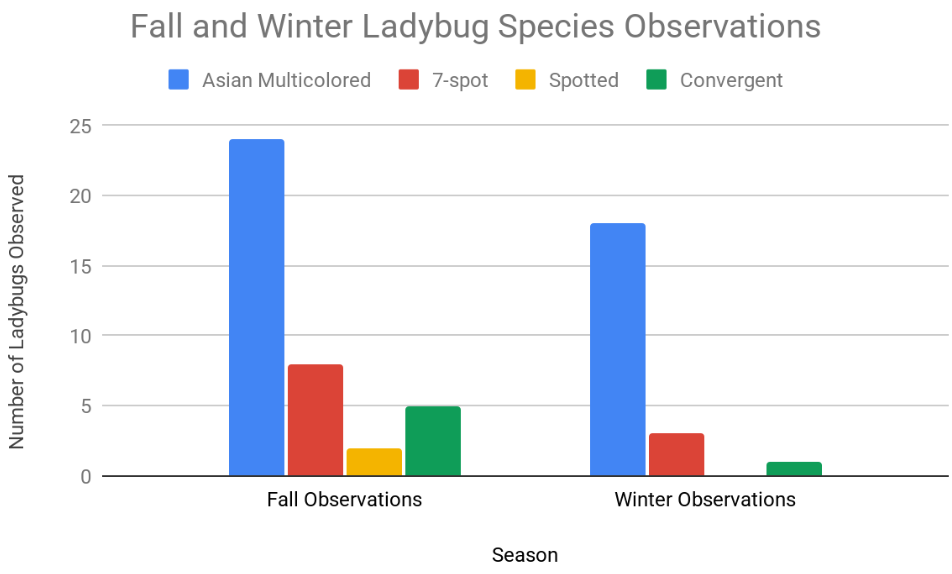
– A breakdown of the variety of species found in each season
Here is a sample data set and what each corresponding graph would look like:
| Fall | Winter |
| 39 ladybugs observed | 22 ladybugs observed |
| Asian Multicolored | 7-Spot | Spotted | Convergent | |
| Fall Observations | 24 | 8 | 2 | 5 |
| Winter Observations | 18 | 3 | 0 | 1 |

Writing Prompt
Using their graphs, have students consider the following:
1. How does the total number of ladybugs observed compare in different seasons?
2. How does the variety of ladybugs observed compare in different seasons?
3. From questions 1 and 2, what can you say about how the presence of ladybugs (both the amount of ladybugs and types of ladybugs) has changed or remained the same throughout the school year?
a. What weather conditions or seasonal changes might explain these changes?
Check student responses for the following:
- Students identify similarities and differences in the seasonal data.
- Students explain differences in data between seasons by referring to data for the same feature (for example, if students think that more ladybugs are observed when temperatures are higher, then they should compare search data with lower and higher temperatures).

Practice Overview: Constructing Explanations
As students analyze and interpret the data, they should be thinking about how they will use the data as evidence to respond to the investigation question: What types (native vs. non-native) ladybugs are we finding in particular seasons in and around our school? As students transition from analyzing data to constructing explanations, encourage students to distinguish between relevant and irrelevant data. When constructing explanations, a decision to include particular data is just as important as a decision to remove data. Remind students that all data reviewed or considered for an explanation is valuable, even if it does not surface in a final explanation. One way to emphasize this is to ask students how they selected the data used in an explanation and how it represents other data used to make a claim.
- Example: A student explanation making connections between the temperature during ladybug searches and observed ladybugs may focus on the number of ladybugs observed at two nonconsecutive temperature ranges (30-40°F and 60-70°F) in the explanation even though the student considered data in other temperature ranges when making a claim. The teacher could ask the student why the ranges used were selected and how the ranges represented the idea the student was trying to communicate in the explanation.
How can I help my students construct explanations?
Some possible strategies include:
- Encourage students to revisit the investigation question multiple times to think about what it is asking.
- Have students think through possible responses to the question that would make sense.
- Redirect students to their data and ask students how the data provide evidence to respond to the question.
- Have students check their responses using their data and consider how reasonable their explanation is and whether there could be any alternate explanations.
Examples of graphic organizers to help students plan and construct their explanations are located here.

Scaffolding Questions to Support Student Data Analysis and Interpretation
The following questions may be useful in helping support student data analysis and interpretation as they make sense of seasonal data:
Temperature
- Did you have any searches that were conducted at the same temperature in different months? When were they, and what are the data for those searches?
- Do you notice any patterns in how many ladybugs were found and the temperature (for example, more or fewer ladybugs are found as the temperature increases or decreases)?
- Do you notice any patterns in the variety of species of ladybugs that were found and the temperature (for example, more or fewer species are found as the temperature increases or decreases)?
Cloud Cover/General Weather
- Did you have any searches that were conducted in the same general weather (sunny, partly cloudy, overcast, light rain, etc.) in the same month? When were they, and what is your data for those searches?
- Did you have any searches conducted in the same general weather (sunny, partly cloudy, overcast, light rain, etc.) in different months? When were they, and what is your data for those searches?
- Do you notice any patterns in the variety of species that were found and the general weather (for example, more or fewer ladybugs found in sunny vs. overcast weather)?
- Did other searchers find the same variety of species as your class did when conducted in the same type of weather?
Combining Temperature and Weather
- Do you notice any patterns in how many ladybugs were found in particular combinations of temperature and general weather (for example, 61-70°F days and sunny vs. 61-70°F days and overcast)?
- Do you notice any patterns in the variety of ladybug species found in particular combinations of temperature and general weather?

Viewing Seasonal Data in iNaturalist
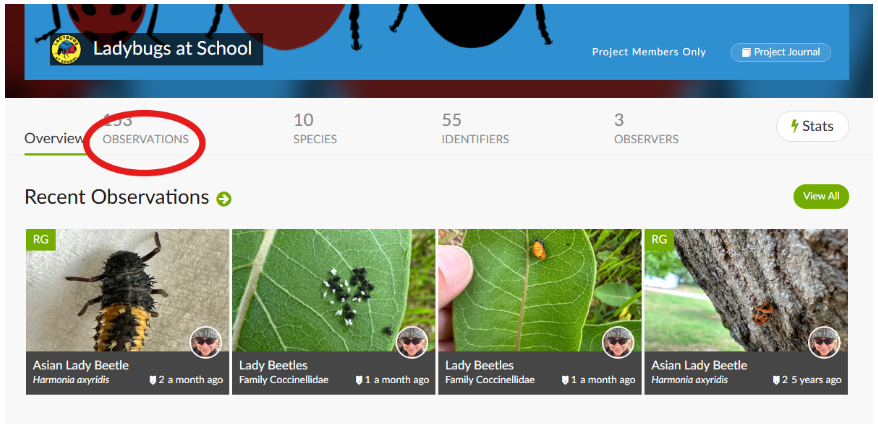
If interested, you can see what ladybug species other searchers have located in different seasons using iNaturalist. Here’s how you can find this information:
1. Visit the Ladybugs at School project page.
2. Select “Observations”
3. Select “List”
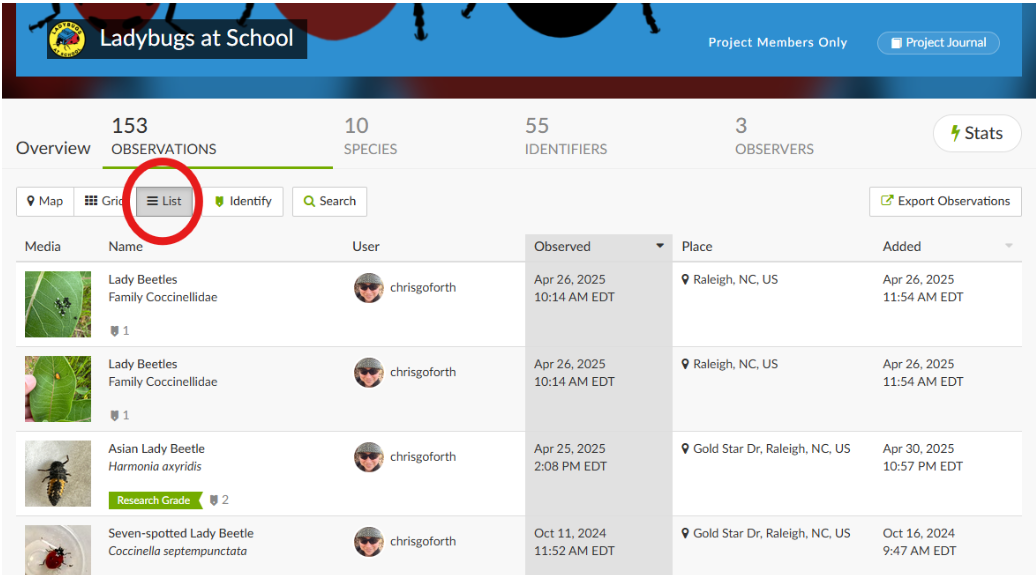
4. Look at the “Observed” column to see what month an observation took place and think about what season that month is in.
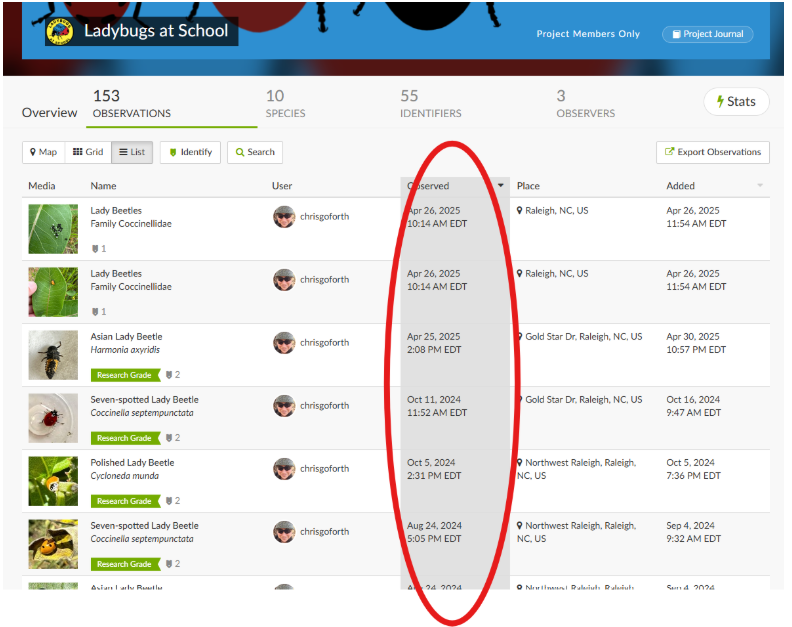
5. Look at the Name and Place columns to think about what species was observed in that season and where it was observed.
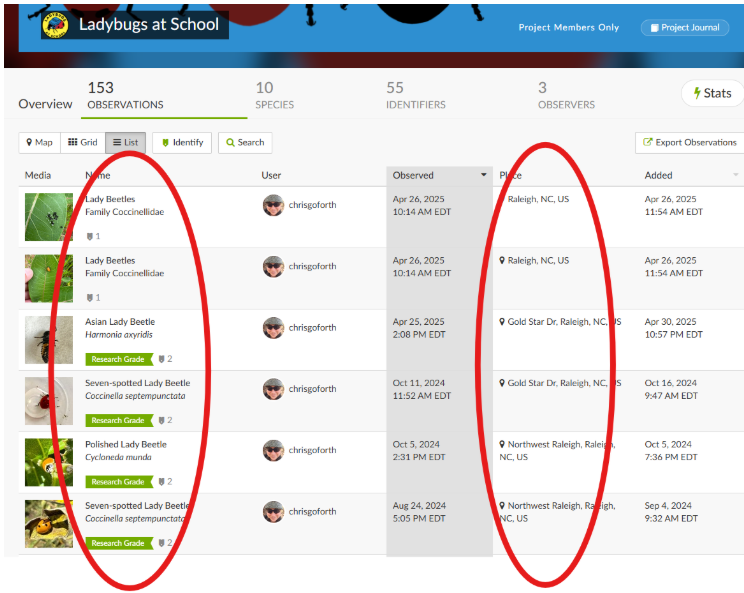
6. If you want to investigate all of the data from the project and use filters, you can export the observation data in the upper right hand corner and download an Excel spreadsheet that allows you to sort the data based on species, location, and/or month observed.
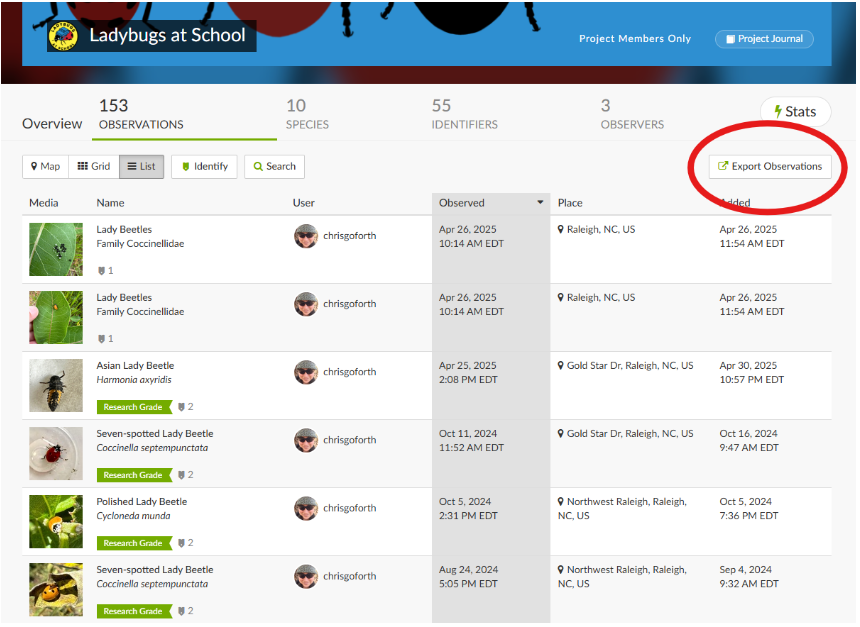
 In next month’s activities, students will be analyzing their School Grounds Map data. Be sure that your School Grounds Map is up to date and consider compiling data collection sheets from your searches throughout the year to help support students as they use this information to discern what improvements might be made to your school grounds to attract more ladybugs.


