Community Collaborative Rain, Hail, and Snow Network (CoCoRaHS)
Enhancing Weather Instruction
Most weather units are taught in schools as just that—a unit, taught during a specified time frame during the school year. The activities shared here have been created as a complement to a weather unit, building a routine of contributing precipitation data to CoCoRaHS, a participatory science project, throughout the entire school year. The yearlong progression of activities designed to accompany this ongoing data collection is not meant to replace a teacher’s weather unit, but rather enrich it and deepen students’ understanding of patterns in weather data.
For more information regarding the
background and purpose of the CoCoRaHS project, refer to the following video (also linked in the media guide):
For information regarding how CoCoRaHS started and a brief overview of measuring different types of precipitation, refer to the following video (also linked in the media guide):
CoCoRaHS
Getting Started (Logistics & Data Collection)
The following information is provided to help you consider the logistics of placing a rain gauge in your schoolyard, as well as how to begin data collection. Each of the resources can also be accessed via the media guide, as well as within the August/September supports.
Getting Started with CoCoRaHS – The Basics of Measuring and Reporting Rain
Tips for placing your rain gauge:
- Slides 16-24 of Training Slide Show (rain gauge placement)
- Slides 25-42 of Training Slide Show (measuring rainfall)
- Equipment and Measurements (more information about rain gauge and measurements)
Sharing your station’s data with CoCoRaHS:
- Quick Guide for entering data using the website and app
- Video walkthrough for entering data
CoCoRaHS
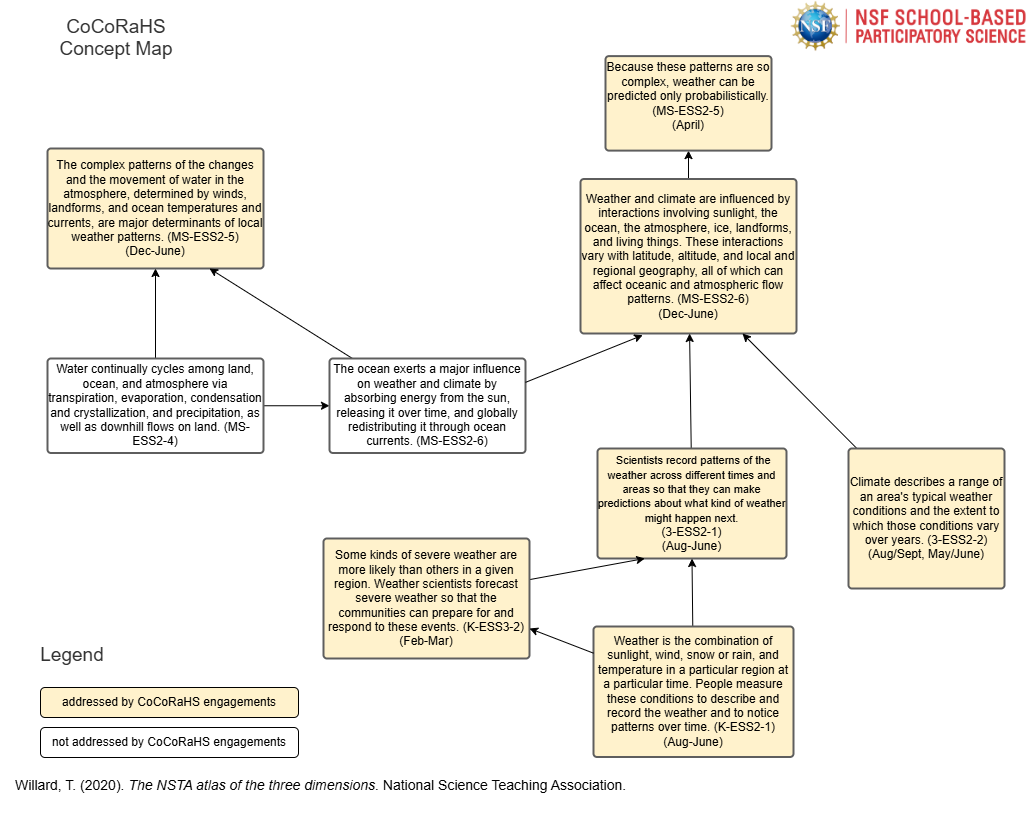
Concept Map & Objectives

Math and Science Connections
Science and math are often intertwined, and CoCoRaHS is no exception. Although the primary focus of most activities provided here is to address science standards, practices, and cross-cutting concepts, math connections have also been established, and math supports are also provided in most months. The materials lend themselves to collaborative planning between math and science teachers. Through purposeful cross-disciplinary work, both science and math content may be integrated through the use of these activities.
Guidance for Participating with Multiple Classes
Do you teach multiple classes throughout the school day? Are you wondering how to routinely collect rain gauge data with each class? Here are some ideas that may help you think through building routines so each of your classes can experience rain gauge data collection:
- Set up multiple rain gauge stations around your school campus and designate a specific rain gauge for each class. This option would also allow you to have conversations with your students about why readings among the gauges sometimes differ.
- CoCoRaHS asks that stations collect data around the same time each day, preferably before 9:30am to display the data on the daily interactive maps. (NOTE: the interactive map defaults to show readings taken between 4:30am and 9:30am, but you can change this setting in the “When” section of Map Options.) However, this is not mandatory. You could rotate which class collects data on a monthly, or quarterly, basis, so long as you routinely collect the data at the same general time with each of your classes. For example, your first period class may collect data for a month at 8:00am; while your second period class may then collect data at 10:15 am for the next month; your fourth period class may collect data at 1:15pm; and so on.
- Have several students (from one class or multiple classes) collect your rain gauge data each morning at the same time and upload the data to CoCoRaHs.org. Alternatively, you (or your students) can take a picture of your rain gauge reading early in the morning. Post the reading (and/or picture) on your front board or a bulletin board for students to see in each of your classes.
CoCoRaHS
Monthly Engagements
August & September
Students orient to protocols for CoCoRaHS data collection and outdoor learning. Consistent data collection in September sets students up for data analysis and interpretation in October.
December
Students compare their own station’s meteorologic fall data with another station in the same region to explore variations in precipitation.
March
Students access historical data and compare the annual precipitation of inland and coastal stations to examine how proximity to large bodies of water affects precipitation.
October
The class graphs daily precipitation measurements recorded in September. By graphing these data and using the Data Explorer Tool from CoCoRaHS, students make sense of day-to-day variation in precipitation.
January
Using qualitative data, students compare their own station’s fall data to stations in different regions.
April
Students explore the causes and impacts of a notable weather event.
November
The class explores additional data tools on the CoCoRaHS website and takes stock of other nearby stations.
February
Students access historical data and compare the annual precipitation of stations on both sides of a mountain range to examine the rain shadow effect.
Culminating Activities
Offering students an opportunity to generate and explore questions of personal interest using CoCoRaHS data.
