Standards + Practices
Science
DCI: ESS2.C The Roles of Water in Earth’s Surface Processes
ESS2.D Weather and Climate
CCC: Cause and Effect
SP4: Analyzing and interpreting data
Students will be analyzing and interpreting data from stations around the US. See Narrative and Science Content Supports.
SP5: Using Mathematics and Computational Thinking
Students will be using mathematics and computational thinking as they analyze and interpret the data from the Water Year Summary Reports for paired stations located inland and along coastlines. See Narrative and Math/Science Content Supports.
Mathematics
MP2: Reason abstractly and quantitatively
MP4: Model with mathematics
MP5: Use appropriate tools strategically
MP6: Attend to precision
Resources + Supports


Alternative 1: Ms. Clark’s Class Explores Proximity to the Atlantic Ocean
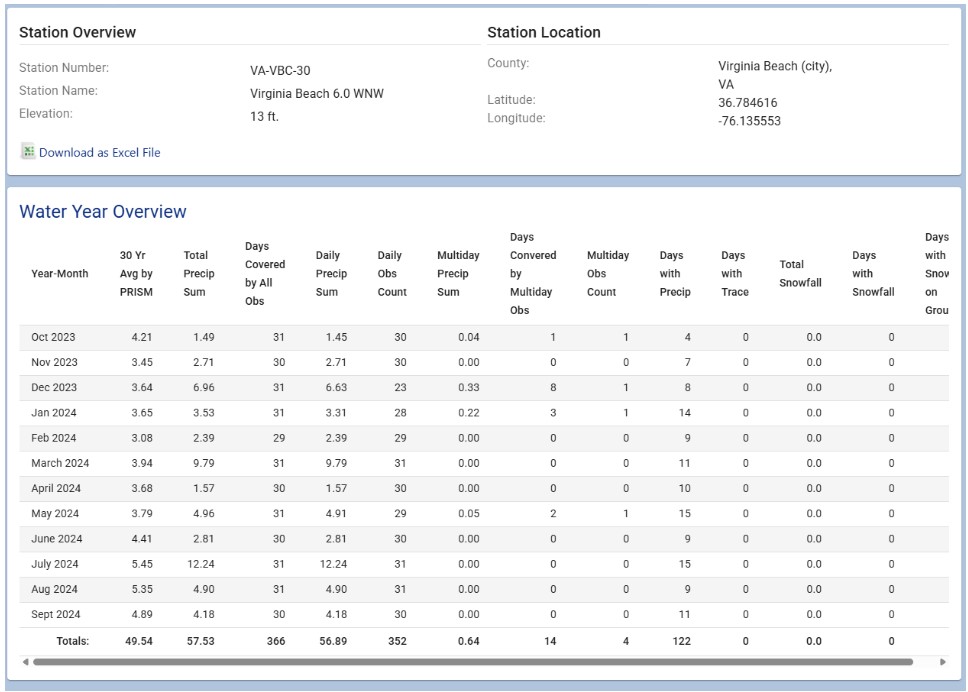
Ms. Clark wants to help students understand that locations near coastlines tend to receive more annual precipitation than inland locations. Ms. Clark has selected three stations across the state of Virginia to illustrate this: one in Virginia Beach, one in Richmond (near the center of the state), and one in Charlottesville (farther from the coast). Knowing that Charlottesville is also on the leeward side of the Blue Ridge Mountains, she intentionally included it to extend what students learned in February. Ms. Clark begins by pulling up the Water Year Summary report for the Virginia Beach station and the station in Richmond to start comparing the two stations.
VA-VBC-30
VA-RCC-14
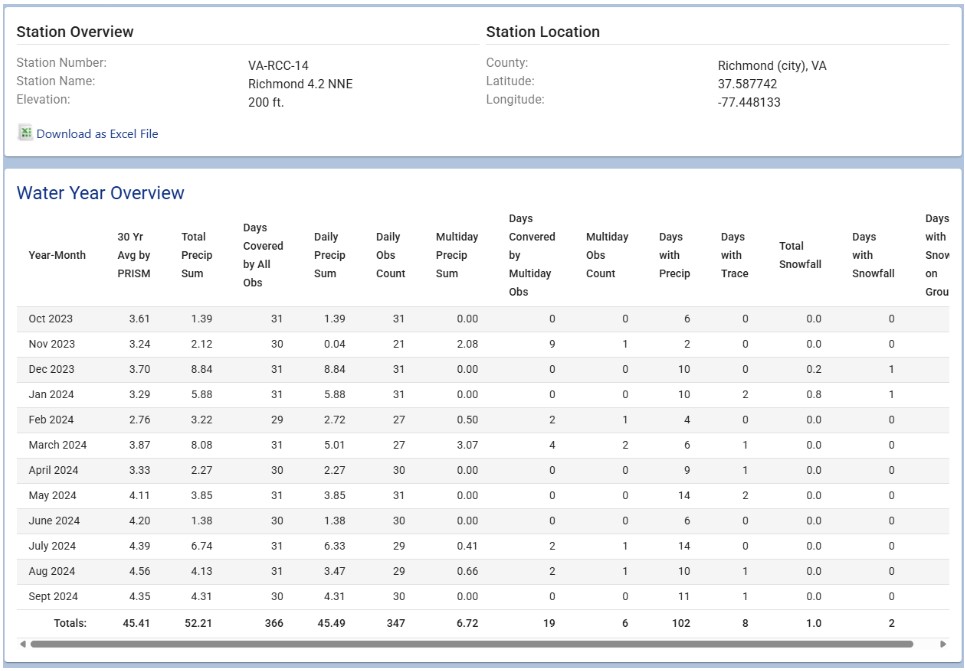
Ms. Clark refers to the Virginia Beach station as Station A and the Richmond station as Station B. She asks students what they notice about the Total Precipitation for each station. Students notice that Station A received more annual precipitation than Station B. Ms. Clark asks students to compare the monthly precipitation of each station. Students notice that even though Station A received a greater amount of precipitation annually, that was not true for each month. Ms. Clark explains that looking at annual precipitation can help the class make comparisons about the overall precipitation and climate of an area and that if they based their claims on only a single month, that could represent as little as two or three precipitation events depending on the month. With this in mind, Ms. Clark points students to the 30-Year Average by PRISM data and students notice that both stations had annual precipitation that exceeds the 30-year average.
To further investigate the claim that annual precipitation decreases for inland locations, Ms. Clark points students to the Water Year Summary for station VA-AB-27 in Charlottesville, VA, or Station C:
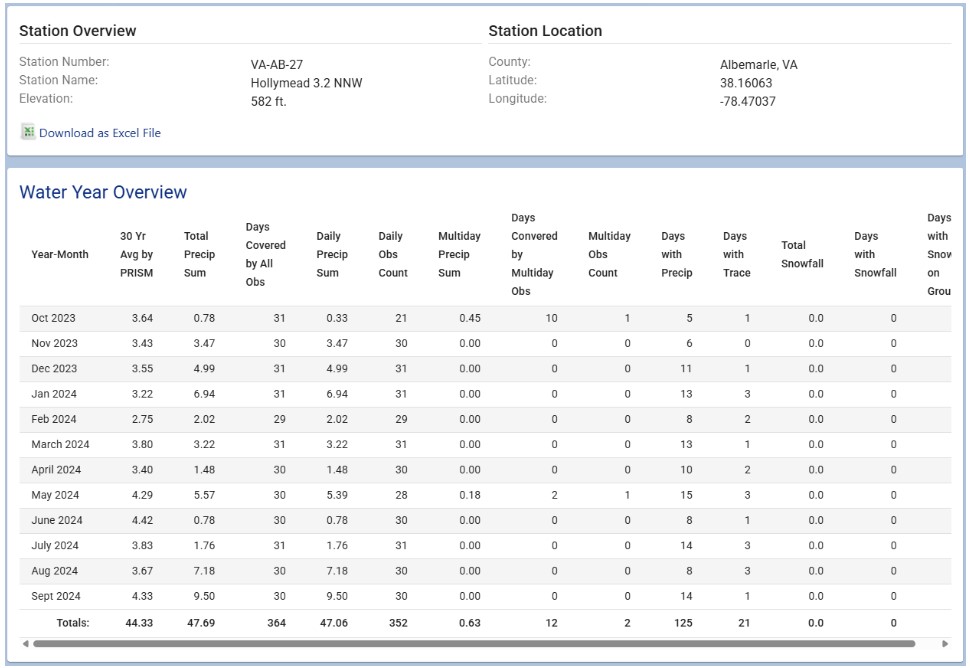
Station C is located about 70 miles west of Richmond. Ms. Clark asks students what they notice about about the Total Precipitation for Station C in comparison to stations A and B. Students notice that like Station B, Station C received less precipitation than Station A. Something else that is interesting to students is that Station C had annual precipitation this year that was closer to its 30-year average than stations A and B. Ms. Clark wonders aloud and uses a map of Virginia as she explains, “If we think about what we learned in February, we also notice that in addition to being further inland than Station B, Station C is also near the Blue Ridge mountains falling on the leeward side of the mountain. This makes me wonder how the rain shadow effect might also affect the precipitation of Station C.” Ms. Clark also encourages students to wonder about how far inland they can go before annual precipitation becomes more stable (and is no longer decreasing) or how close they can get to the coastline before the annual precipitation starts to increase. Throughout the process, Ms. Clark reminds students that there are multiple factors that affect precipitation, and even though proximity to a large body of water, like the Atlantic Ocean for stations in Virginia, has an impact, this is only one factor, and all of the factors work together resulting in the actual precipitation that each station observes.
Alternative 2: Ms. Clark’s Class Explores Representativeness
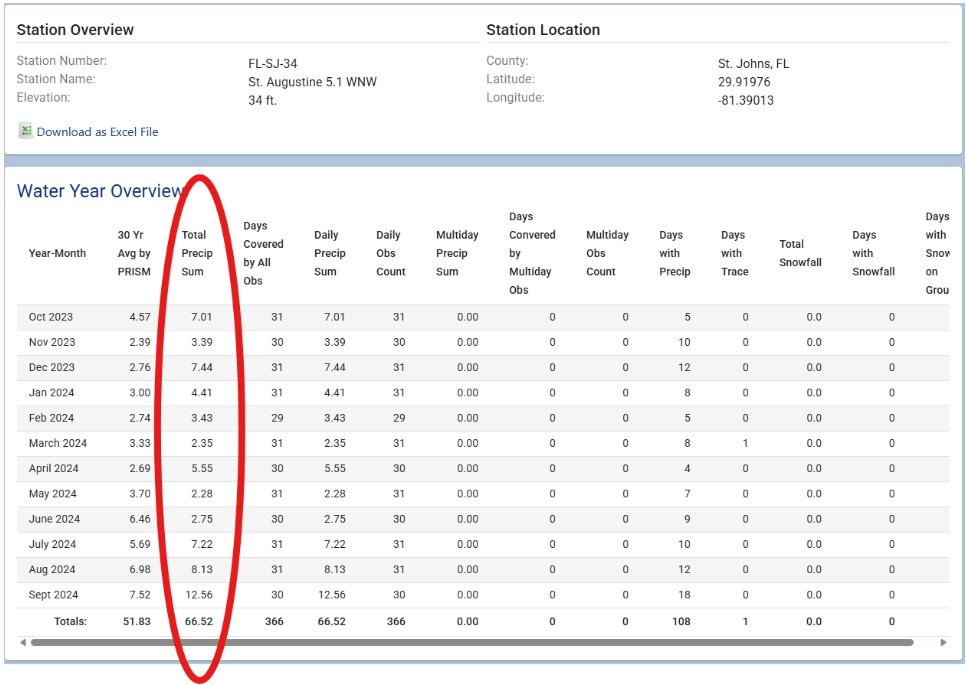
Ms. Clark wants to help students understand that because so many variables impact weather, precipitation trends illustrated by phenomena such as the rain shadow effect and proximity to coastline are not guaranteed. Often, locations near coastlines receive much more rainfall than inland locations, but this is not always the case. To illustrate this, Ms. Clark has selected two stations in Florida to focus on. Station A (FL-SJ-34) is located on Florida’s east coast near St. Augustine and Station B (FL-AL-7) is located about 70 miles inland in Gainesville. As Ms. Clark accesses the Water Year Summary report for each station:
Station A (FL-SJ-34):
Station B (FL-AL-7):
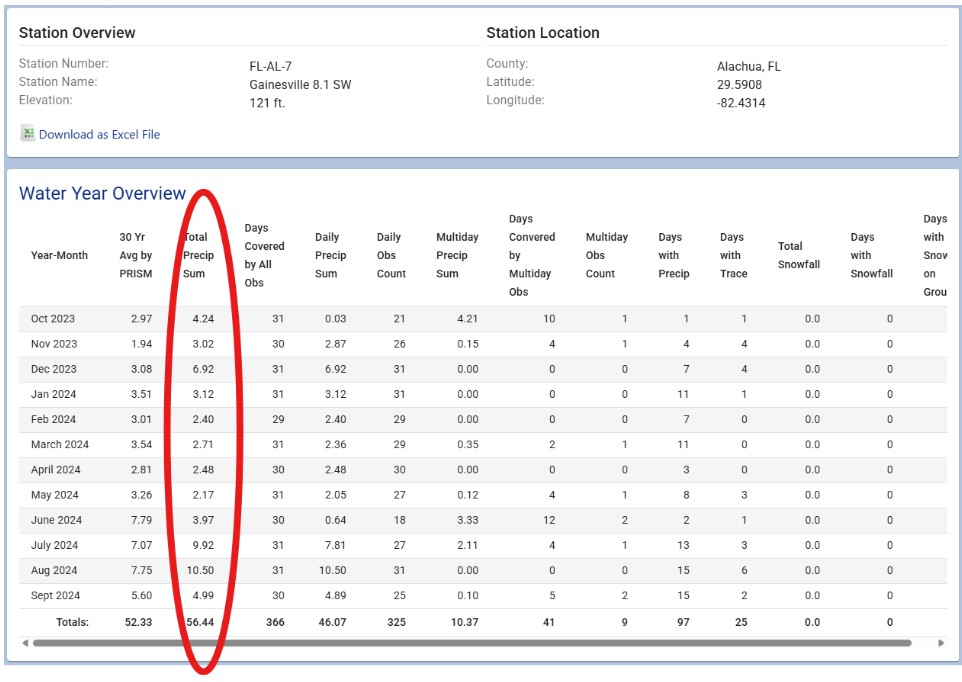
Ms. Clark has students focus on the total precipitation for each month and asks students what they notice. Students notice that throughout the year some months seem to have quite a bit more rain than others. To help focus students, Ms. Clark asks if Station A at the coast has higher precipitation for every month like they would expect or if there are any exceptions. Students are surprised to notice that there are multiple months in which Station B recorded a higher amount of precipitation than Station A. July and August especially stand out with Station B receiving at least 2.00” more than Station A each month.
Ms. Clark wonders aloud about what may have caused this. As she continues to think-aloud to model for students, she first notes that the latitude, longitude, and elevation of the stations are relatively similar. She also mentions the heat and humidity in Florida during these months, but then corrects herself realizing that would affect both stations and notes that this may help explain why this time of year generally has higher precipitation than other months. Finally, Ms. Clark pulls up the stations on the map and points out how much of Florida is on a peninsula, and while Station B is 70 miles from Station A (on the Atlantic Coast), it is also only about 70 miles from the Gulf Coast of Florida. Ms. Clark recalls hearing about a couple of hurricanes last summer and wonders if some of the hurricanes came up the Gulf Coast leaving Station B with more precipitation during those months than Station A. To further investigate, she suggests that they use the Station Report Summary to look at just July and August for both stations. From there, she can look and see if the stations received precipitation on the same days and if so, whether Station A or B received more. (Next month, Ms. Clark plans to use the interactive map to help students track larger precipitation events as they move across the country.) Picking up on Ms. Clark’s comment about much of Florida being on a peninsula, one student suggests that maybe this is only possible because Florida is a state with two coasts and most states don’t have this. Ms. Clark encourages this idea and suggests that they could investigate this by looking at stations further north and find stations in Savannah and Atlanta, Georgia to see if the inland station in a different state consistently has less precipitation than the coastal station.
Ms. Clark ends by reminding students that they have uncovered evidence that trends in precipitation are not guaranteed because Station A had less precipitation than Station B in multiple months. Ms. Clark points out that being detectives and asking questions, even after finding out some answers, is a very important part of being able to explain precipitation trends because trends will not exist as predicted 100% of the time. (Writing prompts in April revisit this idea of only being able to predict weather probabilistically.)

Water Year Summary Report
Selecting Stations
Considerations for selecting stations in March are similar to those in February. For the stations you or your students select, you’ll want to consider geography and data availability:
1. Geography: Look for stations near the coastline of a large body of water and additional stations that are inland in relation to the coastline station. Fortunately, the coastlines of the United States are well populated and offer many station options.
- Moving inland and connecting back to February’s work, also be aware of how close mountain ranges are to the selected stations and whether or not both stations are on the same side (windward vs. leeward) of the mountain.
- Note that in much of the United States, air masses tend to move west to east due to the prevailing winds and jet stream. This means that the effect of being near a coastline could look different on the east and west coasts even though both are ocean coastlines. In addition, winds that blow off a warm body of water tend to increase humidity and rainfall.
2. Available data: As done in February, prioritize using stations that have more complete data sets available. Have students consider why they would want to select stations that have more days covered in their analysis.
Accessing Data
To access the Water Year Summary Report for a specific station, refer back to the February PS support for step-by-step directions of accessing station-specific data.

Analyzing and Interpreting Data
Questions for students to consider when interpreting data between two stations:
- What are the latitude and longitude of each station?
- What is the elevation of each station?
- What was the total precipitation for the water year for each station?
- When comparing the precipitation for each month, does the same station receive more precipitation than another station or does it switch?
- Looking at both stations, what do you notice about precipitation trends during each season?
- Are there any months that surprised you?
- How does the total precipitation for each station compare to the 30-year average for that area?
Extension questions:
- Locate a third station in between your two stations or further inland.
- How does the total precipitation for the water year compare to your other stations?
- What do you notice about the precipitation trends during each season between the three stations?
- Does the precipitation for each month increase or decrease as you get closer to your coastline station?

Using Evidence
Writing prompt to help students reflect on their understanding of how proximity to large bodies of water impacts precipitation:
- Does being located near a coastline seem to increase or decrease the annual precipitation of a location? Use evidence from your stations to support your answer.
Extensions:
- Look at coastal and inland stations on different coasts of the country. Is the same effect observed on the east coast as the west coast? What might explain the similarities and differences between the two?
- What about the different coastlines of a peninsula state (Alaska, Michigan, or Florida)? What might explain the similarities and differences between two coastlines?

Now that students have looked at data patterns of stations near mountain ranges and large bodies of water, next month students will keep these geographic features in mind when making connections to specific weather events. To prepare for the work in April, brainstorm ideas for local and national weather events that have taken place during the school year that students would be familiar with.

