
2: October
School grounds mapping
Purpose: Building on the August/September ladybug identification activities, students map their schoolyard to familiarize themselves with the site and areas of vegetation. Students will use the map to identify areas where ladybugs are found.

As students continue data collection this month, they will create a School Grounds Map to plot their ladybug sightings. This map will be used throughout the school year as students search for ladybugs. 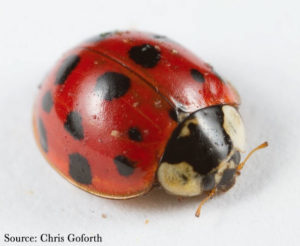 See the Science/Math support “School Grounds Map” below for more information about how to create and use this resource with students.
During ladybug searches this month, be sure that students report the location and weather conditions, even when they don’t find ladybugs, and remind students that their “zeroes” are also useful. Also, keep in mind that students are still developing their ladybug identification skills and will benefit from reminders about how to use the ladybug field guide . If students need additional practice making sense of ladybug species and their identification, consider using the Extensions support below that builds on the Name That Ladybug support introduced in August/September.
Not finding ladybugs? Remember if no ladybugs have been found, that is data too!
Why is it important to record a zero? A zero, or no ladybugs found, is still important to record, as it still gives scientists data for research. To prepare for work in future months with your data, collecting information about locations where you searched, what the temperature was, what the weather was like, and whether or not ladybugs have been found will be key. In particular, knowing that no ladybugs were found during that time, or at that location, or during that type of weather, will be just as important as knowing what ladybugs were found.
The following article discusses “The Positive Side of Zero.”
Standards + Practices
DCI: LS2.A Interdependent relationships in ecosystems
SP3: Planning and carrying out investigations
Students follow procedures set up in August and September to continue regular searches for ladybugs on their school grounds. Students design and use a School Grounds Map to track their yearlong data collection for the investigation.
SP4: Analyzing & Interpreting data
Students make sense of the data they have collected so far using a School Grounds Map to identify areas where ladybugs are more or less likely to be found.
SP5: Using Mathematics and Computational Thinking
Students create a School Grounds Map to plot ladybug sightings. Later in the year, this map will also serve as a model for making recommendations for improvements to the school grounds for attracting ladybugs.
Resources + Supports

Reviewing Observations
As students become familiar with identifying ladybug species and review their observations from the beginning of the year, students can revisit their initial thoughts related to the overarching questions listed in August/September:
1. How does the presence of ladybugs change across the school year? What might explain those changes?
- Which species of ladybugs do we find at our school? Are they native, non-native, or both?
- What features of our school grounds make the space habitable/uninhabitable for native ladybugs?
2. How can we improve the habitat for ladybugs in our schoolyard?

Ms. Jones Modifies the School Grounds Map
Ms. Jones notices that students are eager to search for ladybugs and are ready to plot their data on the School Grounds Map. When working with the School Grounds Map, Ms. Jones realizes that it is sometimes difficult for students to know where to plot their data because it is hard to distinguish between similar microhabitat features. For example, there is one area of the school grounds that has ten identical bushes in a row and even though students remember observing a ladybug in one of the bushes, they can’t recall exactly where they found the ladybug in order to know where they should plot it on the map. Ms. Jones shares the aerial view of their School Grounds to help students visualize where they have searched. To further help students make connections between the aerial view of the School Grounds Map and their outdoor learning data collection activities, Ms. Jones decides to add pictures of specific microhabitat areas around their school grounds to the whole class School Grounds Map as part of the display so that students have an additional reference to use when plotting their data. Knowing that later in the year, they will consider seasonal variation in their data, Ms. Jones also makes a note to herself to take pictures of these locations a couple of times throughout the school year to document any seasonal changes that these areas experience, if any at all.

School Grounds Map
Over the year, it will be important for students to track where and when they find different ladybugs during their searches. One way to help students collect these data is to use a School Grounds Map. In this activity, work with students to understand the aerial view of their school grounds by adding vegetation and other landmarks as necessary to a School Grounds Map that can be used for searches throughout the year and as a class reference in future activities.
Tips and Notes for Designing a School Grounds Map:
- Create a basic outline of large structures/landmarks on a sheet of gridded chart paper (this will serve as the class map). For the student map, there are two choices:
- Take a picture of the chart paper map, print in black and white, and make individual copies for each student. OR
- Recreate the outline on graph paper and make individual copies for all students.
- Note: Be sure to create a coordinate plane when using gridded chart paper for the class map and on graph paper if you are recreating the class map for the individual maps to increase the precision of data collection and provide opportunities for students to work with ordered pairs as part of 5.OA.3.
- Be sure the basic outline class map uses a single color. Different colors will be used later when completing ladybug searches. In the future, a particular color may be associated with each search to help track when particular ladybugs were located.
- Be sure that the map designates center points for each area that takes up significant space (sidewalk, playground, basketball court, soccer field, school buildings, etc.). Then, students can use the center point of each larger area as a reference when sharing ordered pairs.
- Create a key to simplify the drawing. Symbols take up less space than entire words, freeing up more space on the coordinate plane for tracking ladybug sightings.
- For each item on the key, try to include one example of its use in the basic outline that can be referenced when outdoors with students.
- When outdoors, help students make connections between what they observe and the aerial view.
- Allow students time to add points of interest and vegetation to their map.
- After spending time outside, reconvene as a class and use student observations to add points of interest and vegetation to the class map.
- Have students use the aerial view of the school grounds to add additional details.
- Once the School Grounds Map has been created, work together to plot any data collected during ladybug searches in August and September.
Did you know? Smaller areas identified in the key around the school grounds (pavement, bush, other vegetation, trees) are referred to as microhabitats by scientists. Throughout the year, students may notice patterns in the microhabitats where ladybugs are observed and where they are absent.
Example basic outline map:

Example map with student input after spending time outside:


Finding Other Insects
- Is this an insect too? How do you know?
- How could we identify what this insect is?
- The SEEK app is an excellent resource for on-the-spot identification
- The website https://bugguide.net is a free resource and great for identifying all kinds of insects.
- The Kaufmann Guide to Insects in North America would be a good print resource for students to use if web access or downloading apps is not an option.
- How is this insect similar to a ladybug? How is it different?
What if other insects and ladybugs are nowhere to be found?
In certain regions, the weather may already be changing, which may make it difficult to find other insects, as well as ladybugs, while out searching. If students are having difficulty finding ladybugs, refer to the December Monthly Engagement which contains several supports detailing information about overwintering and exploring outside in cooler months.

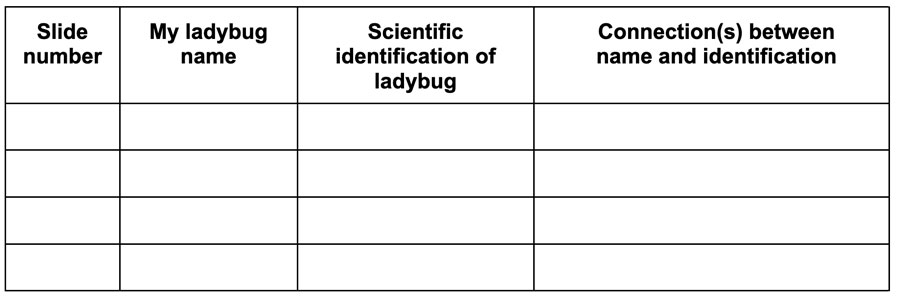
Name That Ladybug
As students continue to work on identifying ladybugs, feel free to revisit the Name that Ladybug resource from August/September through the lens of asking students to identify the ladybugs. Have students consider how the original name they created for each ladybug in August/September is related to its identification using a chart similar to the one below.

Making Predictions Using School Grounds Map
Have students use the class-created School Grounds Map and ordered pairs to predict three spots where ladybugs will be found throughout the year. Ask students to use landmarks on the map as a reference for each prediction. Provide students feedback on their use of ordered pairs and encourage students to share the reasoning they used to make predictions.
Sample Responses and Feedback:
| Student Response (likely range of student responses) | Teacher Feedback |
|
Proficient response: I predict that we will find ladybugs around (33, 4) because there are tall bushes outside of trailer 4 that aren’t cut down. |
Great job including an ordered pair and the trailer as a landmark to your point. I like how you are thinking about the habitat in your reasoning. Would your prediction be any different if the bushes were regularly cut down? |
|
Ordered Pair Error (see example map above): I predict that we will find ladybugs around (13, 38) because the ladybugs might be attracted to the electricity in the electrical boxes. |
Great job using a landmark point for your ordered pair. Check your x-axis and y-axis labels to be sure your ordered pair is correct. I like how your reasoning is thinking about how ladybugs interact with their environment. |
|
Missing information: I predict that we will find ladybugs around (18,28) because ladybugs like to be outdoors. |
What is a landmark that is nearby (18,28)? If ladybugs like to be outdoors and most of the map is an outdoor area, what made you pick (18, 28) as a likely place to find ladybugs and not other locations on the map? |
 As you and your students search for ladybugs, remember to keep your School Grounds Map updated so that it can be used as a resource next month when students make sense of a ladybug’s role in its ecosystem. In particular, students will be looking for evidence of ladybugs as consumers. While searching, consider asking students questions about reasons for why they might be able to observe ladybugs in the locations they are finding them and use those connections next month. In addition, students would benefit from a strong understanding of the importance of zeroes as data (see the blue box above “Not Finding Ladybugs?”) as finding ladybugs may prove to be more difficult than students expect.