Standards + Practices

Science Standards:
LS.5.2.3 Use models to infer the effects that may result from the interconnected relationship of plants and animals to their ecosystem.
ESS.5.1.1 Analyze and interpret data to compare daily and seasonal changes in weather conditions and patterns.
Science Practices
SP1: Asking questions (for science)
SP4: Analyzing and interpreting data
Resources + Supports

The Importance of Consistency
Remember, citizen science relies on the data collected by everyday people, and regular participation is key! The season is changing and more vegetation will be emerging. It will be a great time to get outside with students to continue to collect, photograph, and upload ladybug data as often as possible with your class.
As you’re examining the impacts weather, vegetation, and geographic features have on which ladybugs you find at your school, remember the overarching scientific questions:
-
- Species variance: Do you see differences in the types and number of ladybugs of each type that you find throughout the school year within your local area?
- Geographic variance: Do you see the same patterns across locations throughout North Carolina?
The factors you look at this month can help you better understand why you see the patterns in your ladybug data that you recorded.

Mr. Jones’ Class Notices Patterns
As students look at data from earlier in the year, Mr. Jones notices that students are mainly focused on what season sightings occurred in, perhaps due to their recent study of seasonal variation as part of their weather unit. For example, one student shares that their class seemed most likely to find ladybugs during their search efforts in the fall, highlighting particularly fruitful efforts in late September. This attention to seasons helps Mr. Jones’s students identify patterns in temperature and length of daylight that align with seasonal patterns. Mr. Jones uses his document camera to project the observation recording sheets from those three searches, asking students what they notice. One student points out that they recorded temperatures between 71-80°F on each of the days. Another notices that all of the sightings on those days occurred in a raised garden bed where another class was growing spinach. Mr. Jones then shared a recording sheet from early October, in which the class searched but found no ladybugs, asking students what they notice. One recalls that particular search effort, remembering that it had started raining when they were outside and it felt much colder. Another notes that the temperature they recorded was between 51-60°F. Mr. Jones reminds students that as they review data it is important to consider temperature or other conditions observed in addition to the date or season. One student jokes, “It’s not like the ladybugs have a calendar!” Another adds, “But I bet today feels like spring to them! It’s very warm today. Maybe we should go out to look!”

Vegetation and Ladybugs
As the seasons change, so does the vegetation. In the spring, you may see an abundance of plants beginning to emerge resulting in a greater chance of finding ladybugs (and other insects). In particular, if there are pollinating plants that ladybugs prefer to take shelter on, or because of the insects they will find on them to eat, more ladybugs will tend to be present (the opposite is true as well–if these plants or aphids are not present, fewer ladybugs will tend to be present). If you want more information on the types of plants that might attract ladybugs, refer to the following site: How to Attract Ladybugs. This interconnected relationship between the plants and ladybugs directly links to standard LS.5.2.3: Use models to infer the effects that may result from the interconnected relationship of plants and animals to their ecosystem.

Practice Overview: Analyzing and Interpreting Data
Analyzing and interpreting data involves organizing and graphing collected data and making sense of it (e.g., finding relationships, patterns, outliers). Various tools can be used in data analysis, including spreadsheets and graphing tools. Observation and reasoning help scientists make predictions and form explanations based on the data.
Have students use Google Sheets or graph by hand to generate graphs using data that has been collected throughout the year.
The following video, intended for a teacher audience, provides additional information related to this practice. (0:00-2:55)
https://www.youtube.com/watch?v=9NkT-oYPkOA&feature=youtu.be
Tips for graphing by hand:
- Marking the top of the bar, rather than shading bars, facilitates class collaboration in graphing by allowing students to more quickly plot their point on the graph.
- Throughout these engagements, students will use a bar chart, as it is an appropriate representation of these data.
- A line graph with connected data points would represent change over time. Although ladybug counts change for each search, each search’s count is independent.
- If you plan to display a class graph in your classroom long term, consider having students go back and shade in to create bars when time allows.
- More information on graphing can be found here (intended for teacher use, not student viewing): http://paul-andersen.squarespace.com/beginners-guide-to-graphing-data

Questions to Support Student Data Analysis and Interpretation
- Which location found the more ladybugs?
- What region was it located in?
- What do you know about this location or region that would help you understand why it found the greatest amount of ladybugs?
- How many participants were present and how much time did they spend searching?
- What was the size of the area in which they searched?
- Were the same number of searches conducted during the same times of the year?
- Which location found fewer ladybugs?
- What region was it located in?
- What do you know about this location or region that would help you understand why it found the least amount of ladybugs?
- Considering your work in February regarding weather and ladybugs, how does this compare to the other location’s data?
- Teacher note: consider spotlighting groupwork from the February activity that tackled the temperature and general weather questions.
- According to your data and the other location’s data, does weather affect the number of ladybugs found?

Using Graphs to Compare Data


Writing prompt
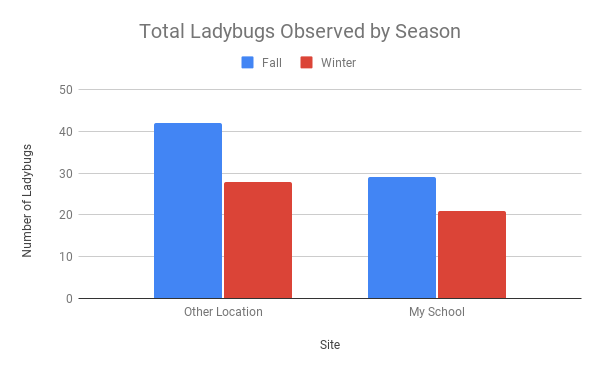
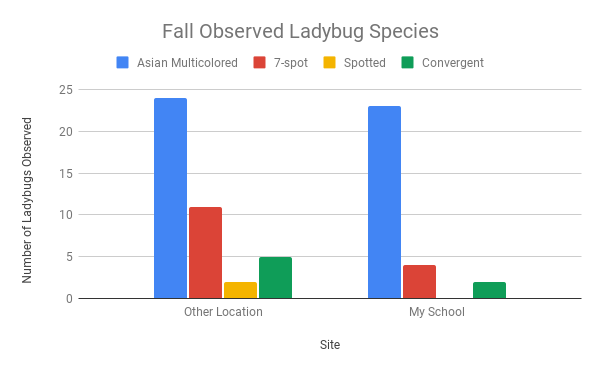
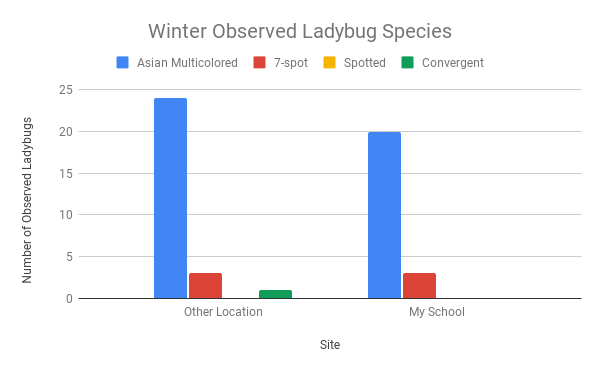
How does the total number of ladybugs observed compare in different seasons between your school and the other location? How does the variety of ladybugs observed compare in different seasons between your school and the other location?
Check student responses for the following:
- Students identify similarities and differences in the seasonal data between both locations.
- Students explain differences in data between locations and seasons by referring to data for the same feature (for example, if students think that the other location found more ladybugs than their school because the other location conducted more searches in a particular temperature range, then the student needs to share supporting data from both locations related to what the temperature ranges were for different searches).
- Students explain similarities in data between locations and seasons by referring to data for the same feature.

Practice Overview-Comparing and Contrasting
Students will compare, contrast, and reflect on many different data points to respond to the scaffolding group questions throughout this activity. Many fifth-grade students struggle to compare parallel aspects of an idea effectively. Use the graphic organizers below as references to guide students to make sense of patterns in ladybug sightings. Making these comparisons will be key in helping students to answer the overarching scientific questions.
Graphic Organizer-Own School
*If sharing the graphic organizer structure with students, be sure to keep at least one example with all columns completed as a model for students.
| What factor are you comparing? | Category 1 of the Factor | Category 2 of the Factor |
Data Sample Response
– Describing the evidence |
Comparison Sample Response – Interpreting the evidence and making comparisons – Include a wondering and other relevant connections |
| Weather conditions- air temperature | 30-40 degrees Fahrenheit | 61-70 degrees Fahrenheit | When it was between 30 and 40 degrees Fahrenheit, we observed 2-3 ladybugs each time we searched. When it was between 61 and 70 degrees Fahrenheit, we observed 5-9 ladybugs each time we searched. | We observed more ladybugs during a search when the outdoor temperature was 61-70 degrees Fahrenheit than when it was 30-40 degrees Fahrenheit. This makes me wonder why we found fewer ladybugs when the temperature was lower. Is it because of the temperature or something else? |
| Weather conditions- cloud cover | Overcast | Sunny | Four of our ladybug searches took place on overcast days. During those searches we found 3, 6, 7, and 10 ladybugs. Five of our searches took place on sunny days. We found 1, 3, 3, 4, and 6 ladybugs. | Most of the time, we found more ladybugs during our searches on overcast days than we did on sunny days. This makes me wonder if ladybugs avoid direct sunlight. That would make sense because some of the ladybugs we found on sunny days were in the shade. For example, on the sunny day in November, when we found 4 ladybugs, 3 of them were in the shade. |
Graphic Organizer-Comparing Our School to another location


Ladybug Data Outside North Carolina
If students are curious about ladybug data from other US states, providing them time to use the data tools available on the LLP website might be beneficial for extending their thinking. The following questions could help you facilitate this extension:
- What resource could you use to find data about ladybugs that have been found outside of North Carolina? (Lost Ladybug website: LLP Data and Mapping)
- Where might you begin looking? Is there another state you are curious about? (If not, suggest Colorado, as this state has different habitats and weather than North Carolina and has an abundance of ladybug data uploaded on the website).
- Which tool might help you find data to analyze? (The Pie Charts link on the left hand side of the LLP Data and Mapping page would be useful.)
- What are you wondering about or interested in learning more about? (e.g., Which state has the most sightings? Which species has been found the most? Which habitat have ladybugs been found in most frequently in a specific state? Help students narrow down their ideas to input the correct choices for data for the pie chart feature.)
- What have you discovered from your pie chart data? Did this help answer your question?
 In next month’s activities, students will be analyzing their schoolyard map data, as well as another location’s data to find similar locations where ladybugs have been found and the features of these locations. Using this information, students can discern what improvements might be made to your school grounds to attract more ladybugs.


