Standards + Practices

Science Standards:
ESS.5.1.1 Analyze and interpret data to compare daily and seasonal changes in weather conditions and patterns
ESS.5.1.2 Analyze and interpret weather data to explain current and upcoming weather conditions in a given location.
ESS.5.1.3 Construct an explanation to summarize the ocean’s influences on weather and climate in North Carolina
Science Practices
SP4: Analyze and interpret data
SP5: Using mathematics and computational thinking
SP6: Constructing explanations
Math Standards:
NC.5.MD.2 Represent and interpret data: Collect data by asking a question that yields data that changes over time.
Resources + Supports

Making Sense of Patterns
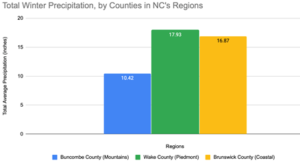
- Which station had the least/greatest amount of precipitation?
- What region was it located in?
- Do you think other stations in this region have recorded more or less precipitation than this station? Why?
- What do you know about this station’s location or region that would help you understand why it had the greatest/least amount of precipitation between the three stations?

Ms. Clark’s Class Explores Representativeness
Ms. Clark is concerned that her students may be overgeneralizing findings from stations in other regions and their corresponding counties and starting to draw conclusions about regions more broadly. She would like students to consider the representativeness of average county totals to deepen their understanding of how precipitation can vary within a region and the factors that influence such variations.
Citizen science data collection often generates results that are unexpected. In this case, Ms. Clark’s students are surprised to learn that their county recorded more precipitation this past winter than the counties they have looked at in other regions. They are particularly surprised by how much less precipitation the station in the mountains measured over the past few months (10.42 inches) compared to their own piedmont county total (17.93 inches) and the coastal station’s county total (16.87 inches).
To better understand how representative their mountain region station’s county is of the mountain region more broadly, students decide to calculate average winter precipitation for surrounding counties. Students determine that all of the adjacent counties each recorded about 13 inches of precipitation over the winter, with one recording nearly 16 inches. Students now know that the county they have been looking at is not necessarily representative of the mountains region and are curious to know what’s causing this difference.

To prepare for next month’s activity, have a map of North Carolina that displays the other station’s locations (one station in their location and one station in each of the other two regions) printed and ready for use. Students will use the map to look for differences in location and geographic features in making sense of the multiple seasons’ variations in precipitation.


 they might affect the precipitation in a particular region. Students may tend to overgeneralize their findings for the counties in the different regions, which provides an opportunity to explore nearby counties to determine how representative the county is of the region (similar to how representativeness is addressed in November, averaging multiple stations in a county).