Standards + Practices

Science Standards:
ESS.5.1.1 Analyze and interpret data to compare daily and seasonal changes in weather conditions and patterns
ESS.5.1.2 Analyze and interpret weather data to explain current and upcoming weather conditions in a given location
ESS.5.1.3 Construct an explanation to summarize the ocean’s influences on weather and climate in North Carolina
Science Practices
SP1: Asking questions and defining problems
SP2: Developing and using models
SP4: Analyze and interpret data
SP5: Using mathematics and computational thinking
SP6: Constructing explanations and designing solutions
Math Standards:
NC.5.MD.2 Represent and interpret data: Collect data by asking a question that yields data that changes over time.
NC.5.NBT.7 Compute and solve real-world problems with multi-digit whole numbers and decimal numbers
Math Practices
MP5: Use appropriate tools strategically
Resources + Supports

Communicating with Other CoCoRaHS Station Schools
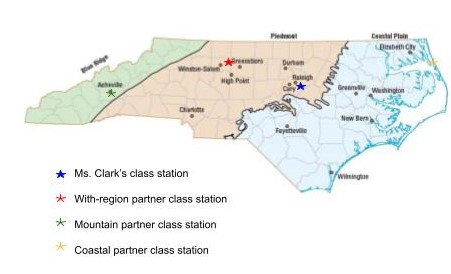
An engaging extension experience for students would be to arrange an opportunity to communicate with other schools that have CoCoRaHS stations in different regions, ideally in real-time, if possible (e.g., Skype, Zoom, Google Meet). Students from the other school could share the graphs they created in February and communicate their findings of seasonal variation within their region with other stations in different regions. Students could also pose and answer questions that classes have about their region. After communicating with the other school, students might consider what they have learned about seasonal variation from the stations across the state and how that supports or refutes their initial ideas about differences by location. See example in narrative section.

Ms. Clark’s Class Connects with Other Schools
After having her class participate in the project for several months, Ms. Clark would like to allow students to communicate what they have learned and gather more in-depth information about two other schools. Ms. Clark reached out to the teachers at two other schools to arrange times for virtual meet-ups.

She planned to spend two 45-minute class periods on CoCoRaHS sensemaking in April and scheduled a 20-minute video call with one of the schools each day. She wanted to ensure that students could get the most out of the 20-minute call and that students would feel prepared to pose and respond to questions. During the first 25 minutes of the class period, she facilitated a discussion among her students as they reviewed the data they examined the previous month. They generated a list of questions for the other school (e.g., How does being close to mountain ranges affect your precipitation? In which season did you record the most precipitation? Why do you think that is? Does it mostly rain where you are or have you measured other types of precipitation? Have you had any sports events impacted by weather? Was there a weather event near you that made the news recently?) Ms. Clark reminds the class that students from the other school will have similar questions for them. They role-play, asking and answering questions about their region being sure to include everyone in the discussion and practice. During the 20-minute call, Ms. Clark’s class spends the first 10 minutes answering questions from students at the other school and the last 10 minutes posing their questions. Ms. Clark takes notes on chart paper so that her students can refer back to this when constructing their explanations about seasonal and regional variation in precipitation.

Constructing Explanations Using Data as Evidence
An important scientific practice is to construct explanations using scientific data as evidence for support and students would benefit from doing so this month by reflecting in writing. They have analyzed an abundance of data this month and taking time to consider what they have learned by writing about it would provide a great opportunity for sense making. Ideas for writing prompts:
Which geographic feature do you think influenced the other location’s data the most? Why do you think that?
What additional evidence could be collected to help determine how much this factor affects the weather in a given location?
If the location of our county was in a different region, do you think that would affect our weather data? Support your answer with specific examples.

Compiling Student Work
As students have been working on CoCoRaHS activities throughout the school year, they have many potential artifacts that could be useful during the culminating project when they will be investigating a question of interest. Taking some time to help students organize their work in preparation for the culminating activitiy would be very beneficial.
Artifacts:
|
Month |
Potential Artifacts |
| Throughout the year |
|
| August/September | |
| October |
|
| November |
|
| December |
|
| January |
|
| February |
|
| March |
|
| April |
|

Next month, students will begin working on a culminating project to communicate what they’ve learned about precipitation data collection and analysis. If you have time to begin sooner than that, it may be beneficial for your students to provide the extra time for them to get started. In addition, students will be generating investigable questions and might need extra guidance. Prepare copies of the rubric from the assessment support to review with students prior to beginning the work. By sharing with students the identified outcomes students will have guidance as they prepare their final projects. The expert connections support also has ideas for connecting with and finding local scientific support for your students.


