Community Collaborative Rain, Hail, and Snow Network (CoCoRaHS)
9 Lessons
This project encourages people across the US to place standardized rain gauges in their spaces and submit daily precipitation reports to improve our overall understanding of meteorological patterns.
Because precipitation can vary so much over even small areas (e.g., it could be raining at your house while your neighbor’s house stays dry!), reports made by CoCoRaHS citizen scientists give researchers access to precipitation data of a much finer scale than is possible using standard meteorological equipment.
CoCoRaHS data have already led to a greater understanding of overall precipitation patterns and many organizations and individuals, including the National Weather Service and other meteorologists, emergency managers, hydrologists and other scientists, utilities personnel, land managers, and community members use this valuable data.
CoCoRaHS
Getting Started
After registering on the CoCoRaHS website, you can get started by placing a rain gauge at your school and reporting the precipitation it collects on a daily or near-daily basis. The videos below provide an excellent overview of the project, including where to place your gauge, how to read the gauge, and how to report your findings to CoCoRaHS.
Getting Started with CoCoRaHS – The Basics of Measuring and Reporting Rain. (2014, June 16).
Animated video for students to learn about using a rain gauge to measure rain and reporting these measurements on the CoCoRaHS website, 4:11
Introduction to CoCoRaHS. (2011, July 15).
Video explaining how CoCoRaHS started and brief overview of measuring different types of precipitation, 5:48.
* Best suited for teacher background knowledge
The Story of CoCoRaHS. (2011, December 13).
Animated video detailing the background and purpose of the CoCoRaHS project, 4:00.
Ideas for discussion questions at various stopping points:
- At 1:40: What do you think the phrase (“Rain doesn’t fall the same on all”) means?
- ~2:30: What was unique about the flooding event in 1998?
- End: Who might benefit from this project and how?
CoCoRaHS
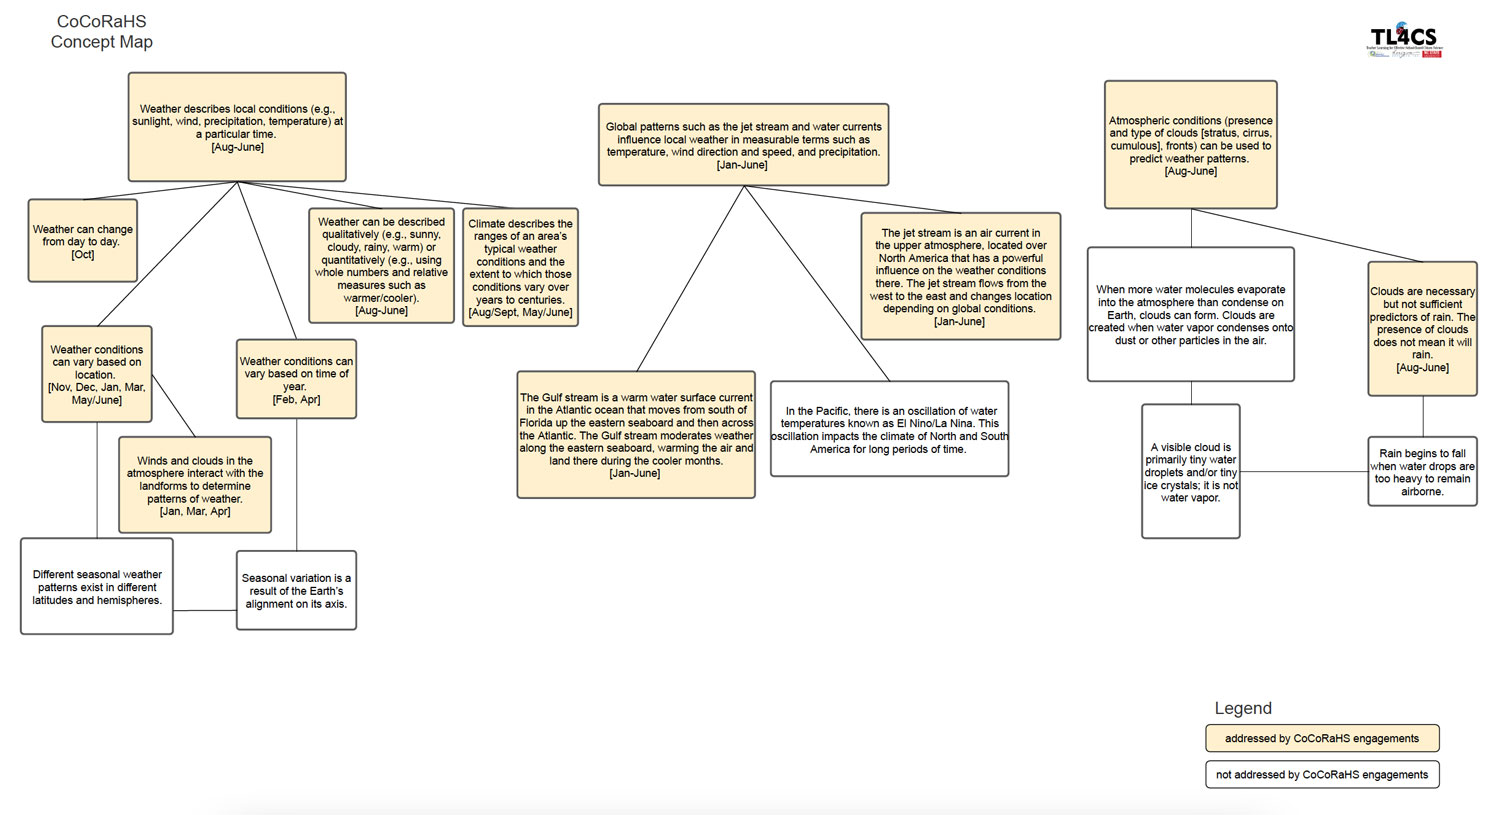
Concept Map & Objectives

Understand how Earth systems (hydrosphere and atmosphere) impact patterns of weather and climate. ESS.5.1
- Analyze and interpret data to compare daily and seasonal changes in weather conditions (including wind speed and direction, precipitation, and temperature) and patterns. ESS.5.1.1
- Students know that weather changes daily and seasonally and is the condition of the atmosphere (e.g., temperature, wind speed and direction, precipitation, cloud cover, air pressure) in a given time and place.
- Students use weather tools (e.g. thermometer, barometer, wind vane, anemometer, rain gauge) and digital resources to collect data (e.g., daily weather) and organize data sets.
- Students analyze and interpret data (e.g., graphs, charts, etc.) to reveal daily and seasonal patterns and communicate results
- Analyze and interpret weather data to explain current and upcoming weather conditions (including severe weather such as hurricanes and tornadoes) in a given location. ESS.5.1.2
- Students know many factors are measured to describe and forecast weather conditions (e.g., wind speed and direction, precipitation, temperature, and air pressure).
- Students use collected weather data to explain weather conditions.
- Students know scientists/meteorologists use weather tools and digital resources to predict upcoming weather (e.g., weather balloons, radar, weather satellites) and use maps to keep track of atmospheric conditions.
- Students know large air masses with certain properties form over land and over the ocean; the movement and interaction of air masses are used to forecast weather. Air mass properties include temperature (cold, warm) and moisture (moist,dry).
- Students identify atmospheric conditions that are associated with predictable weather patterns.
- Students know how maps can be used to track severe weather including tornadoes and hurricanes.
- Construct an explanation to summarize the ocean’s influences on weather and climate in North Carolina. ESS.5.1.3
- Students know that local weather conditions are influenced by global factors (water currents):
- The Gulf stream is a warm water surface current in the Atlantic Ocean that moves from south of Florida up the eastern seaboard and then across the Atlantic. It moderates weather along the eastern seaboard (including NC), warming the air and land during the cooler months.
- The Coastal Plain of North Carolina experiences a milder winter climate than our mountains due to geography and proximity to the ocean.
- Students use maps and data to track hurricanes.
- Students summarize how weather is influenced by ocean temperatures (e.g., when the ocean is warm, more clouds form and more rain falls in that part of the world).
- Students know that local weather conditions are influenced by global factors (water currents):
- Use models to explain how the sun’s energy drives the processes of the water cycle (including evaporation, transpiration, condensation, precipitations). ESS.5.1.4
- Students know the sun’s energy fuels the water cycle and impacts different aspects of the water cycle (evaporation, transpiration, condensation, precipitation).
CoCoRaHS
Monthly Engagements
August & September
Students orient to protocols for CoCoRaHS data collection and outdoor learning. Consistent data collection in September will set students up for data analysis and interpretation in October.
October
The class graphs daily precipitation measurements recorded in September. Graphing these data helps students make sense of day-to-day variation in precipitation.
November
Focus on broadening students’ access to precipitation data as the class explores the CoCoRaHS website and takes stock of other nearby stations.
December
Students use maps and precipitation data to examine variation in weather across different locations.
January
Students compare their own precipitation data with that of another station nearby.
February
Students access historical data and use computational tools to examine seasonal variation within a region.
March
Students compare winter precipitation across regions of the state to understand regional variation.
April
Students compare precipitation across regions of the state across four seasons.
Culminating Activities
Offering students an opportunity to generate and explore questions of personal interest using CoCoRaHS data.
